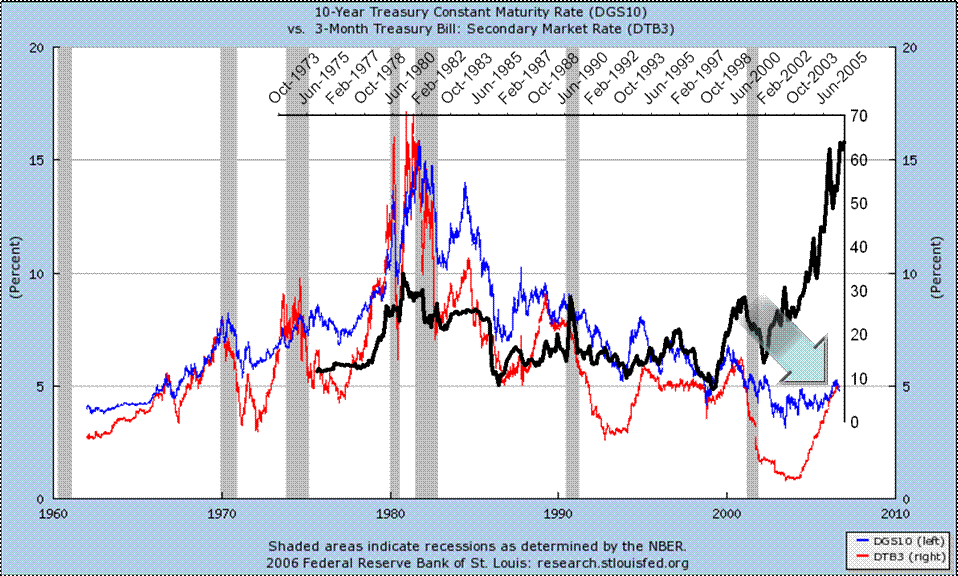
In order to understand what may happen to FX rates in 2007, below, we attempt to abbreviate Venezuela’s last 30 years of monetary history through three graphs. Figure 1 points to the perpetual reality behind our economic performance: oil prices. In turn, Figure 2 shows how oil prices have affected Bolivar monetary mass (M3), and finally, Figure 3 shows what happened each time M3 grew unconstrained as oil prices climbed. Please refer to the description under each graph for exact details.
Even if you superficially review these graphs, you can see that, just like the years 1983 or 1996 were nothing like the “increasing-oil-price” years that preceded them, 2007 will be nothing like the past three years. From the first graph, you can tell the Negative Spread (explained underneath it) taking place now is essentially heralding a downturn in US economic activity that may turn into a full recession as GM, Ford, Delphi and other transport-sector companies continue massively laying off workers as they always have before or during previous recessions. From that same graph, you can see that oil prices most probably will return to the $25-35 per barrel level they had before starting their latest foray to the high seventies.
On the second graph, we are confronted with the stark reality that, as oil prices drop, we will be producing 1 million barrels less per day (-30%) than we did ten years ago, but our population is nearly 5 million people (+20%) larger. From that graph, you can also tell that our propensity to convert every oil-revenue dollar into Bolivars is what fires up our monetary supply every time oil prices soar.
In the last graph, you can see how it is that Venezuela ultimately corrects its monetary excesses. As international reserves are the only real backing Bolivars have, when the dollar value of Bolivar monetary mass (M3) doubles or triples over the dollars in reserve, the implicit FX rate (M3 divided by reserves) skyrockets over the value of the official FX rate. Eventually, as oil prices descend, monetary authorities have no choice but to align the official FX rate to an equal or higher rate than the implicit rate. For next year, the graph projects that implicit FX rate to be near Bs, 5000/$. However, should the authorities choose not to align the official FX rates to that level, there probably won’t be many dollars available at the official rate. In that circumstance, most of the private economy will be forced to access the “permuta” market and consequently bid its rate up to the level of the implicit rate.
We believe that an exceptionally large portion of the $22 billion excess trapped in Bolivars in the Venezuelan banking system (roughly equal to the Bs. 47 trillion in CDs issued by the BCV in August) will be caught by the next maxi-devaluation. Our opinion is that it will be very hard, if not impossible for corporate managers to believe the story told by the historical graphs below, given the rather easy availability of preferential dollars obtained by them since 2003 (only affordable through high oil prices). In the mean time, monetary authorities take advantage of their self-created, excess-liquidity conditions by selling Bolivar bonds at yields of 6% p.a, fixed for up to 14 years (TIF 2020). Similarly, private issuers are racing to come to market over the next 3 months with over Bs. 600 billion in 3 to 5 year issues. You are welcome to join the party! Besides being specialists on hedging currency risk, we are experts at issuing securities.
Fig. 1. From 1969 until 2001, the yield of the 3mth Treasury (red) exceeded the 10yr Treasury’s (blue) in six occasions (the occurrence is called a Negative Spread). In each instance, the Negative Spread preceded a US recession by six to 18 months. Coincidentally, each recession brought international oil prices (black) down to the levels they started climbing from before the recession. Since July 17th of this year, the Negative Spread has reappeared for the seventh time over 37 years (see arrow). If a recessionary period follows, Venezuelan oil prices may drop to the levels where they started from in 2004 ($25-$35/ barrel)
Fig. 2. Over the past 30 years, Venezuela’s oil production (gray) reached a maximum of 3.4 million BPD in Dec-97, but it’s down today to 2.4 million BPD. However, monthly oil revenues (green) tripled since 2004 as oil prices tripled, but since we converted them all into local currency, our monetary mass (red) more than quadrupled since 2004 (includes BCV absorption).
Fig. 3. Over the past 30 years, Venezuela’s monetary mass (red) has experienced three periods of extremely high acceleration that took it outrageously beyond its hard currency backing (green). In each instance, the Official FX rate (blue) has been deliberately kept below the implicit FX rate (yellow) for political reasons, until eventually allowing the former to match up with the latter


Leave a Reply